ESPC House Price Report - October 2026
Every month, we publish the latest information about the local property market such as the average house price in Edinburgh, the Lothians, Fife and the Scottish Borders. You'll also find information on selling times, sales volumes, the number of properties coming to market and many more statistics in the house price report. Read on to find out the latest house price information.
Regional Quicklinks
Edinburgh | East Lothian | Midlothian | West Fife & Kinross | East Fife | West Lothian | Scottish Borders
Key Takeaways
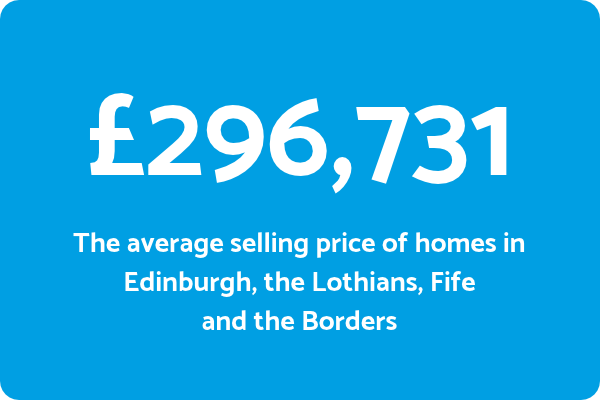
- The average selling price of property in Edinburgh, the Lothians, Fife and the Borders was £296,731 during August - October 2026, with no change year-on-year.
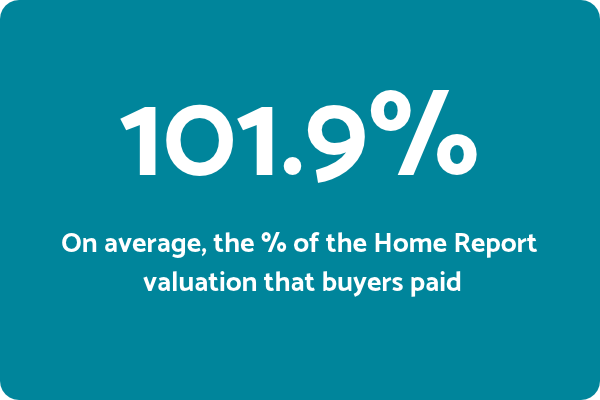
- Properties achieved 101.9% of their Home Report valuation on average, down 0.3 percentage points from last year.
- New property listings were down 0.6% while sales volumes decreased by 10.4%.
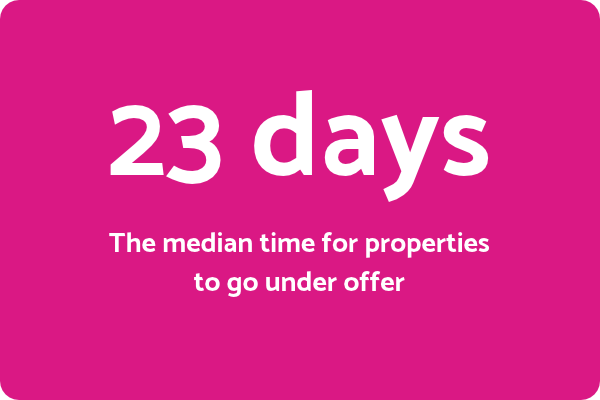
- The median selling time was 23 days, one day slower than the period August - October 2025.
- 18.7% of homes went to a closing date, down from 21.5% last year.
Market overview
The Scottish property market experienced a slowdown during August to October 2026, as ongoing economic uncertainty, higher household costs and growing speculation that the Bank of England could raise interest rates continued to influence buyer behaviour. That rise has since been confirmed, with the Bank of England increasing Bank Rate from 3.75% to 4% on 5th November.
Sales volumes fell by just over 10% compared with the same period last year, while property listings remained relatively stable, suggesting that sellers are still motivated to move despite the more challenging financial climate. Average selling prices were unchanged at £296,731, although there were notable differences in performance across individual regions.
Midlothian recorded strong growth, with prices increasing by almost 4% to reach a record high for this period. Edinburgh also provided a more positive picture, with prices recovering from the summer dip to settle at a similar level to last autumn.
Overall, the figures point to a market where activity has softened, but property values have largely held their ground.
Inside the Edinburgh property market
| Property Type |
Average House Price |
Annual Change |
Median Time To Sell |
Annual Change |
% of Home Report Valuation Achieved |
Annual Change |
| House | £417,918 | +1.3% | 21 days | No change | 103.1% | Up 0.4 % points |
| Flat | £273,772 | +0.8% | 21 days | 1 day faster | 102.2% | Down 0.2 % points |
Here's how Edinburgh's market performed between August - October 2026:
- Average selling price: £314,200 (down 0.1% year-on-year)
- Time to under offer: 21 days (one day faster than last year)
- New listings: Up 2.8% compared to the same period last year
- Sales volumes: Down 9.8% year-on-year
- Sales with a closing date: 21.3%, down from 24.1% last year
- Properties listed as 'Offers Over': 86.0%, up from 77.3% last year
What’s selling in Edinburgh?
Flats continued to dominate Edinburgh’s sales market, with one- and two-bedroom properties featuring prominently among the most popular property types. Gorgie continued to offer some of Edinburgh’s most accessible property prices, with one-bedroom flats averaging £159,173. At the more premium end of the market, the collective area of Morningside, Marchmont and Bruntsfield saw an average selling price of £414,656 for flats.
Leith remains Edinburgh’s busiest market
Leith continued to lead Edinburgh for sales. Despite volumes falling by 6.9% year-on-year, the area remained comfortably ahead of Corstorphine. One- and two-bedroom flats were particularly popular in this ever-popular location close to the city centre. Properties in Leith achieved an average of 103.1% of their Home Report valuation, highlighting continued competition among buyers.
Trinity tops Edinburgh for Home Report valuation achieved
Trinity recorded one of Edinburgh’s strongest results, with properties achieving an average of 105.1% of their Home Report valuation. This was an increase of 0.5 percentage points year-on-year. With properties taking an average of just over 15 days to go under offer, the figures suggest that demand remains particularly strong in this part of the city.
A steady but more measured market
Edinburgh’s average selling price reached £314,200 during August - October 2026, remaining broadly unchanged compared with last year. Sales volumes fell by 9.8% to 1,770, while the median time to go under offer remained relatively stable at around 21 days. Properties achieved an average of 102.4% of their Home Report valuation, although closing dates became less common, suggesting a more measured market.
Inside the East Lothian property market
| Property Type |
Average House Price |
Annual Change |
Median Time To Sell |
Annual Change |
% of Home Report Valuation Achieved |
Annual Change |
| House | £354,911 | -2.9% | 28 days | 5 days slower | 102.0% | Down 0.8 % points |
| Flat | £213,458 | -1.5% | 27 days | 7 days faster | 101.4% | Up 0.4 % points |
Here’s how East Lothian’s market shaped up during August - October 2026:
- Average selling price: £313,530 (down 3.9% year-on-year)
- Time to under offer: 27 days (two days slower than last year)
- New listings: Down 0.5% compared to the same period in 2025
- Sales volumes: Down 2.4% year-on-year
- Sales with a closing date: 19.4%, down from 24.0% last year
- Properties listed as 'Offers Over': 83.0%, up from 72.1% last year
Buyers are finding value across the region
Buyers looking for more affordable options are finding opportunities beyond East Lothian’s premium coastal locations. One-bedroom flats in Musselburgh averaged £154,433, while two-bedroom houses in Tranent averaged £196,182. Prestonpans also offered value, with two-bedroom flats averaging £170,917. These prices provide alternatives for first-time buyers and those looking to move within the region.
More choice in certain parts of the region
Although overall new listings remained broadly stable when compared with last year, supply increased noticeably in some locations. Haddington recorded a 37.2% rise in new listings, while Musselburgh saw a 16.7% increase. Longniddry and Pencaitland also experienced decent growth, giving buyers more options.
Premium locations continue to attract buyers
East Lothian’s more expensive property markets remain appealing, with North Berwick recording an average selling price of £490,232, up 3% year-on-year. Four-bedroom houses there averaged £759,277, whilst achieving an average of 106.2% on the Home Report valuation. East Linton recorded an average selling price of £504,902, with homes in this picturesque rural village going under offer in a median time of just 13 days.
A cautious but still competitive market
East Lothian’s average selling price fell 3.9% to £313,530, while sales volumes dipped by 2.4%. Properties also took slightly longer to go under offer, averaging 27 days. However, homes still achieved 101.9% of Home Report valuation. With closing dates falling to 19.4% of sales, the market appears competitive but less pressured than last year.
Download the ESPC App
Searching for a new home? The ESPC app puts property search at your fingertips. Discover homes for sale, personalise your search, save properties you love and keep up to date with new listings. Download the ESPC app today and put your property search in your pocket.


Inside the Midlothian property market
| Property Type |
Average House Price |
Annual Change |
Median Time To Sell |
Annual Change |
% of Home Report Valuation Achieved |
Annual Change |
| House | £305,888 | -1.5% | 22 days | 2 days slower | 101.5% | Down 0.7 % points |
| Flat | £173,295 | +3.3% | 21 days | 2 days slower | 100.8% | Down 1.0 % points |
Here’s how Midlothian’s market performed between August - October 2026:
- Average selling price: £279,471 (up 3.8% year-on-year)
- Time to under offer: 21 days (one day slower than last year)
- Average percentage of Home Report valuation achieved: 101.4% (down 0.7 percentage points)
- Sales with a closing date: 16.9%, down from 19.2% last year
- Properties listed as 'Offers Over': 85.5%, up from 77.0% last year
What’s selling in Midlothian?
Three-bedroom houses are proving particularly popular with Midlothian buyers, with top-selling Bonnyrigg recording 31.3% more sales than last year, at an average of £265,860. Penicuik chipped in the second highest sales volumes of three-bedroom homes, closely followed by Dalkeith and Danderhall, the latter of which saw average prices of this property type increasing by 18.0% year-on-year. The figures point to continued demand for practical family homes across the region.
More affordable options for buyers
Buyers seeking a lower-cost entry to the market found opportunities in Dalkeith and Gorebridge. Two-bedroom flats in Dalkeith averaged £174,273, while two-bedroom houses in Gorebridge averaged £172,530, highlighting good alternatives to the larger family homes dominating sales volumes.
Prices rise as the market becomes more measured
Midlothian was one of only two regions that saw an increase in average selling price, rising by 3.8% year-on-year to £279,471. Despite sales volumes declining by 3.7% year-on-year, and the average percentage of Home Report valuation attained lessening by 0.7 percentage points, sellers remained confident in Midlothian, as evidenced by an 8.5 percentage point rise in the use of the “offers over” pricing strategy compared to last year.
Inside the West Fife & Kinross property market
| Property Type |
Average House Price |
Annual Change |
Median Time To Sell |
Annual Change |
% of Home Report Valuation Achieved |
Annual Change |
| House | £250,067 | -6.7% | 22 days | 7 days slower | 102.3% | Down 0.7 % points |
| Flat | £151,445 | +14.3% | 12 days | 1 day faster | 102.6% | Down 1.1 % points |
Here’s how the market looked in West Fife & Kinross during August - October 2026:
- Average selling price: £226,262 (down 0.1% year-on-year)
- Sales volumes: Down 27.5% on last year
- New listings: Down 4.9% compared to the previous year
- Time to under offer: 17 days (two days slower than last year)
- Sales with a closing date: 14.7%, down from 15.3% last year
- Properties listed as 'Offers Over': 85.9%, no change from last year
What’s selling in West Fife & Kinross?
Mid-priced homes are holding up best. Dunfermline’s three-bedroom houses recorded 7.3% more sales than last year, while sales of four-bedroom houses fell 43.6% year-on-year. Rosyth’s three-bedroom houses followed the trend, with sales up notably. Higher borrowing costs appear to be steering buyers towards practical family homes.
Where buyers are finding value
Cowdenbeath averaged £139,000 with homes achieving 105.6% of valuation, while Rosyth averaged £157,394 and Dunfermline’s two-bedroom flats averaged £147,268, selling in around 11 days. With higher mortgage costs and household bills squeezing affordability, buyers are focusing on lower-priced areas where borrowing needs are smaller, and competition for well-priced homes remains strong.
Listings outpace sales
Although new listings were down 4.9% on last year, they remain above the number of sales, so supply is outpacing demand and buyer pressure is easing. Sellers remain confident, with 85.9% of homes marketed at Offers Over, unchanged year-on-year. In Dunfermline, prices still edged up 1.8% to £231,964 and homes achieved 102.9% of Home Report valuation, showing that those who did buy were willing to pay for well-priced properties.
Inside the East Fife property market
| Property Type |
Average House Price |
Annual Change |
Median Time To Sell |
Annual Change |
% of Home Report Valuation Achieved |
Annual Change |
| House | £300,324 | -5.1% | 53 days | 2 days faster | 97.2% | Down 3.6 % points |
| Flat | £222,035 | +9.2% | 71 days | 37 days slower | 96.9% | Down 0.8 % points |
Here’s how East Fife’s market performed during August - October 2026:
- Average selling price: £278,900 (down 3.9% year-on-year)
- Sales volumes: Down 32.6% on last year
- Average percentage of Home Report valuation achieved: 96.2% (down 3.8 percentage points)
- Properties listed as 'Offers Over': 90.5%, up from 82.6% last year
St Andrews: still the busiest, but buyers are in no rush
St Andrews had the highest volume of sales, although this was down 13% year-on-year, and its average price eased 1.4% to £372,156. Homes achieved just 93.5% of Home Report valuation and took a median of 151 days to go under offer, 53 days slower than 2025. Even in this perennially popular town, cautious buyers are taking their time and negotiating hard rather than rushing to outbid each other.
Crail and Anstruther go separate ways
Crail’s average price rose 8.5% to £377,857, led by three-bedroom houses averaging £408,750 (up 37%), though sales fell 41.7% and homes reached only 95% of valuation. Anstruther sales rose 14.3%, but prices fell 16.7% to £218,688, highlighting that the East Neuk is proving a highly selective market.
Fewer new listings, but sellers hold firm
New listings dipped 12.8% to 95, and the average Home Report valuation fell 13.8% to £276,705, suggesting fewer higher-value homes reached the market. Yet sellers remain bullish, with 90.5% marketed at Offers Over, up from 82.6%, even as buyers are paying below Home Report valuation on average.
Inside the West Lothian property market
| Property Type |
Average House Price |
Annual Change |
Median Time To Sell |
Annual Change |
% of Home Report Valuation Achieved |
Annual Change |
| House | £329,869 | +4.4% | 25 days | 5 days faster | 100.8% | No change |
| Flat | £147,136 | +27.2% | 34 days | 5 days faster | 102.0% | Up 2.5 % points |
Here’s how West Lothian’s market performed during August - October 2026:
- Average selling price: £302,706 (up 4.7% year-on-year)
- New listings: Down 2.4% compared to August - October 2025
- Time to under offer: 26 days (five days faster than last year)
- Sales with a closing date: 14.9%, down from 16.7% last year
- Properties listed as 'Offers Over': 65.0%, up from 63.4% last year
Fewer sales, higher values
West Lothian’s average selling price rose 4.7% to £302,706, outperforming the cooling picture seen across much of the East of Scotland. Sales fell 17.8% year-on-year; however homes still achieved 101.1% of valuation and went under offer five days faster than the same period in 2025.
Winchburgh sees prices surge
Winchburgh’s average price jumped 23.7% to £355,849, standing out in a market that is otherwise more measured. Three-bedroom houses averaged £370,037 (up 37%), selling in 24 days at 112.1% of valuation. With so few sales, the mix of homes sold will exaggerate the rise, but demand for well-priced homes is evident.
Inside the Scottish Borders property market
| Property Type |
Average House Price |
Annual Change |
Median Time To Sell |
Annual Change |
% of Home Report Valuation Achieved |
Annual Change |
| House | £264,239 | -9.2% | 29 days | 5 days slower | 99.8% | Down 0.8 % points |
| Flat | £139,112 | +26.1% | 25 days | 2 days slower | 100.6% | Up 4.1 % points |
Here’s how the Borders’ market performed during August - October 2026:
- Average selling price: £232,180 (down 0.1% year-on-year)
- New listings: Down 0.4% compared to the same period last year
- Sales volumes: Up 3.1% year-on-year
- Median time to under offer: 27 days (four days slower than last year)
- Sales with a closing date: 8.5%, down from 9.7% last year
- Properties listed as 'Offers Over': 56.1%, down from 57.4% last year
Galashiels: still the busiest, and still keenly contested
Galashiels led the Scottish Borders in terms of sales volume, although this was down 5.7%, and the average price dipped 9.2% to £149,601. Even so, homes achieved 102.2% of Home Report valuation and went under offer in 17 days. New listings jumped 37%, giving buyers more choice, but competition for sensibly priced homes remains lively.
Where buyers are finding value
Hawick was the standout affordable market, with sales up 33.3% and an average price of £143,400. Homes went under offer 29 days faster than the previous year, at a median selling time of 22 days. Looking at specific property types, two-bedroom flats in Galashiels were the most affordable, selling for an average of £128,358.
FIND OUT HOW MUCH YOUR HOME IS WORTH
Want to find out more about our House Price Reports? Read our House Price Report FAQs, or check out our House Price Reports Explained series.
Find out average property selling prices for different areas and property types in our house price table.
See data for previous months and years in our historical house price spreadsheet.
ESPC is the home of property and we're here to help you with every step of your home-buying and selling journey. If you're thinking of buying or selling a property soon, why not drop into our Property Lounge to chat with one of our experts. Sellers can also get a free property valuation with ESPC agents.