ESPC House Price Report - August 2026
Every month, we publish the latest information about the local property market such as the average house price in Edinburgh, the Lothians, Fife and the Scottish Borders. You'll also find information on selling times, sales volumes, the number of properties coming to market and many more statistics in the house price report. Read on to find out the latest house price information.
Regional Quicklinks
Edinburgh | East Lothian | Midlothian | West Fife & Kinross | East Fife | West Lothian | Scottish Borders
Key Takeaways
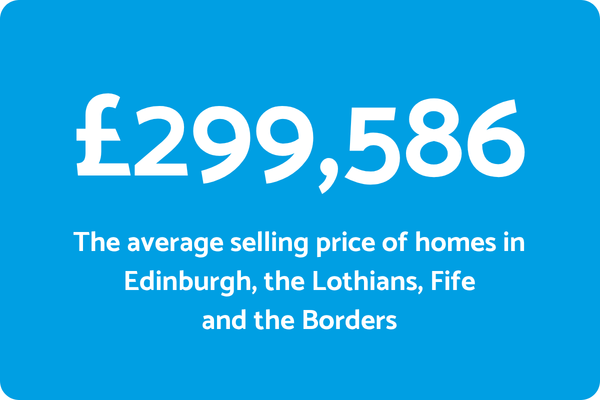
- The average selling price of property in Edinburgh, the Lothians, Fife and the Borders was £299,586 during June - August 2026, up 2.1% year-on-year.
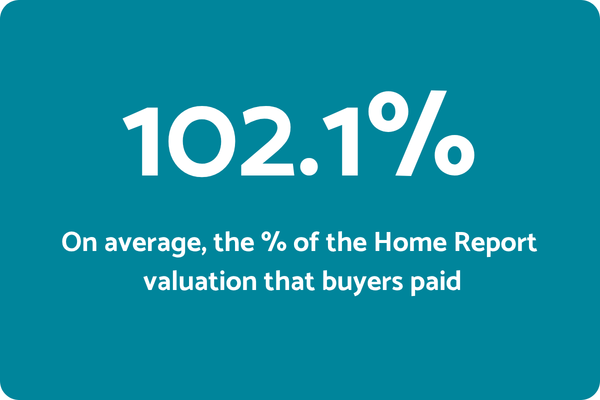
- Properties achieved 102.1% of their Home Report valuation on average, down 0.3 percentage points from last year.
- New property listings were down 0.2% while sales volumes decreased by 6.0%.
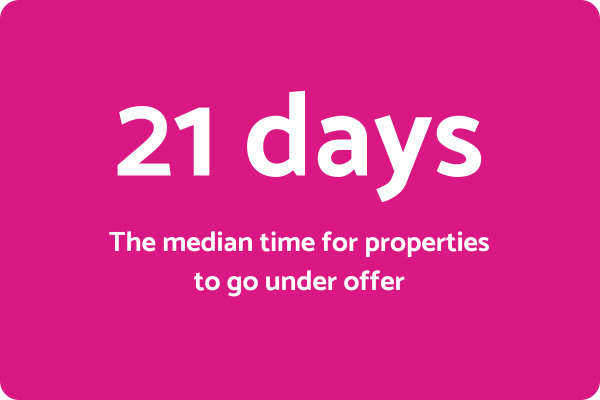
- The median selling time for property was 21 days, keeping pace with rate that homes sold during the period June - August 2025.
- 19.8% of homes went to a closing date, down from 22.2% last year.
Inside the Edinburgh property market
| Property Type |
Average House Price |
Annual Change |
Median Time To Sell |
Annual Change |
% of Home Report Valuation Achieved |
Annual Change |
| House | £426,578 | +3.6% | 21 days | No change | 103.1% | Up 0.2 % points |
| Flat | £275,555 | +2.4% | 20 days | No change | 102.5% | Down 0.2 % points |
Here's how Edinburgh's market performed between June - August 2026:
- Average selling price: £317,070 (up 1.1% year-on-year)
- Time to under offer: 21 days (one day slower than last year)
- New listings: Down 1.5% compared to the same period last year
- Sales volumes: Down 5.2% year-on-year
- Sales with a closing date: 22.8%, down from 24.6% last year
- Properties listed as 'Offers Over': 89.8%, up from 75.1% last year
Trinity sees a surge in activity
Trinity was one of Edinburgh’s strongest-performing areas, with sales increasing by 28.3% year-on-year. Average selling prices also rose by 16.3% to £382,021. Two-bedroom flats were particularly popular, while properties overall achieved an average of 104.1% of their Home Report valuation.
Where are buyers finding value?
Gorgie remains an attractive option for buyers looking for a more affordable entry point in the capital. One-bedroom flats averaged £157,493, with sales volumes increasing by 31.8% year-on-year. Abbeyhill also offered relatively accessible prices, with one-bedroom flats averaging £204,281 and sales on this property type rising by 33.3%.
Edinburgh’s fastest-selling properties
Meadowbank was particularly quick, with one-bedroom flats selling in an average of just 11 days - fifteen days faster than last year. The Shore was another fast-moving market, with two-bedroom flats selling in around 15 days. Elsewhere in the capital, Leith, Polwarth and Bruntsfield also recorded selling times of around 15 - 16 days.
A steady but competitive market
The average Edinburgh selling price reached £317,070, up 1.1% year-on-year, while the median time to go under offer remained unchanged at 21 days. Properties achieved an average of 102.6% of Home Report valuation, suggesting that competition remains healthy. However, with sales down 5.2% and the proportion of sales involving closing dates falling, the market appears active but increasingly measured.
Inside the East Lothian property market
| Property Type |
Average House Price |
Annual Change |
Median Time To Sell |
Annual Change |
% of Home Report Valuation Achieved |
Annual Change |
| House | £350,293 | -1.4% | 22 days | 3 days faster | 102.4% | Down 0.5 % points |
| Flat | £211,228 | +3.2% | 29 days | 7 days slower | 100.1% | Down 1.4 % points |
Here’s how East Lothian’s market shaped up during June - August 2026:
- Average selling price: £319,636 (up 3.8% year-on-year)
- Time to under offer: 23 days (two days faster than last year)
- New listings: Up 11.6% compared to the same period in 2025
- Sales volumes: Down 2.1% year-on-year
- Sales with a closing date: 19.4%, down from 22.5% last year
- Properties listed as 'Offers Over': 86.4%, up from 74.5% last year
Musselburgh remains the busiest market
Musselburgh recorded the highest number of sales in East Lothian, as well as the most new listings coming onto the market - a figure which increased 20.8% year-on-year. Two-bedroom flats were Musselburgh’s most popular property type, followed by three-bedroom houses that sold for an average price of £310,239.
Strong demand continues in Dunbar and Haddington
Dunbar was one of the strongest-performing markets, with sales increasing by 26.5% during June - August. Two-bedroom houses were particularly popular, with sales more than tripling year-on-year, while three-bedroom house sales rose by 60%. Haddington also continued to perform strongly, with sales of three-bedroom houses rising by 17.6% year-on-year, with an average price of around £282,708.
Where buyers are finding value
Tranent and Musselburgh continue to offer some of East Lothian’s more accessible price points. Two-bedroom houses in Tranent averaged £190,876, while two-bedroom flats in Musselburgh averaged £186,358, providing relatively affordable options for buyers looking to remain within commuting distance of Edinburgh.
A resilient market despite changing conditions
The number of sales remained broadly stable year-on-year, while new listings increased by 11.6%, giving buyers more choice. Despite this, properties continued to sell relatively quickly, and the average selling price increased by 3.8% to £319,636. The figures point to a healthy and competitive market, particularly for well-priced family homes.
Download the ESPC App
Searching for a new home? The ESPC app puts property search at your fingertips. Discover homes for sale, personalise your search, save properties you love and keep up to date with new listings. Download the ESPC app today and put your property search in your pocket.


Inside the Midlothian property market
| Property Type |
Average House Price |
Annual Change |
Median Time To Sell |
Annual Change |
% of Home Report Valuation Achieved |
Annual Change |
| House | £317,799 | +5.3% | 27 days | 7 days slower | 101.4% | Down 0.7 % points |
| Flat | £160,569 | -8.2% | 29 days | 15 days slower | 100.0% | Down 3.2 % points |
Here’s how Midlothian’s market performed between June - August 2026:
- Average selling price: £281,013 (up 3.4% year-on-year)
- Time to under offer: 27 days (nine days slower than last year)
- Average percentage of Home Report valuation achieved: 101.0% (down 1.4 percentage points)
- Sales with a closing date: 15.1%, down from 24.6% last year
- Properties listed as 'Offers Over': 84.7%, up from 76.6% last year
Buyers finding value in Dalkeith
Dalkeith continued to offer some of the most accessible prices in Midlothian, particularly for flats. Two-bedroom flats averaged just £163,925, with sales volumes of this popular property type enjoying a 33.3% increase year-on-year. This combination of relatively affordable prices and rising demand makes Dalkeith an interesting market for buyers.
Demand remains strong for family homes
Family-sized houses continued to feature prominently among Midlothian’s sales. Three-bedroom houses accounted for several of the region’s strongest-performing property types, with particularly strong volumes in Bonnyrigg, Dalkeith and Penicuik. Gorebridge also saw a significant increase in demand for two-bedroom houses, with sales rising by 60% year-on-year to eight.
A more measured but still competitive market
Midlothian’s average selling price rose to £281,013, up 3.4% year-on-year, despite sales volumes falling by 10.8%. The median time to go under offer increased from 18 to 27 days, suggesting that properties are taking longer to secure a buyer. However, competition remains evident: 84.7% of properties were marketed as Offers Over, up from 76.6% last year, while properties achieved an average of 101.0% of their Home Report valuation.
Inside the West Fife & Kinross property market
| Property Type |
Average House Price |
Annual Change |
Median Time To Sell |
Annual Change |
% of Home Report Valuation Achieved |
Annual Change |
| House | £247,375 | -8.5% | 15 days | 1 day slower | 103.4% | Down 0.4 % points |
| Flat | £146,065 | +8.9% | 14 days | 15 days faster | 103.5% | Up 0.2 % points |
Here’s how the market looked in West Fife & Kinross during June - August 2026:
- Average selling price: £223,140 (down 5.4% year-on-year)
- Sales volumes: Down 21.3% on last year
- New listings: Down 7.1% compared to the previous year
- Time to under offer: 15 days (one day slower than last year)
- Sales with a closing date: 17.3%, down from 17.6% last year
- Properties listed as 'Offers Over': 91.7%, up from 83.7% last year
What's selling in West Fife & Kinross?
Dunfermline continued to lead the region for both sales and listings. Three-bedroom houses in Dunfermline remain the region's best-seller, selling for an average of £247,945. But the real story is two-bedroom houses in the town, up 47.4% year-on-year, making them the fastest-growing property type in the area. Two-bedroom flats in Dunfermline were the quickest to shift, selling in just 10 days on average.
Where buyers are finding value
Cowdenbeath remains the area's most accessible market, averaging £132,188 across house and flat sales - down 17% year-on-year - while sales volumes rose by a third. Dunfermline's flats also offer relative affordability, with two-bedroom flats averaging just under £150,000 whilst still achieving 105.6% of Home Report valuation.
A quieter market, but competition remains strong
The average selling price across West Fife & Kinross fell 5.4% year-on-year to £223,140, with sales down 21.3%. This appears to be due to higher volumes of buyers purchasing smaller, and therefore cheaper, properties, rather than an overall decline in property prices. This continues the pattern we saw in this region earlier in the summer and may hint at trends to come as we head into autumn. Yet competition hasn't eased: 91.7% of properties were marketed offers over (up from 83.7% last year), and 86.2% achieved at least Home Report valuation.
Inside the East Fife property market
| Property Type |
Average House Price |
Annual Change |
Median Time To Sell |
Annual Change |
% of Home Report Valuation Achieved |
Annual Change |
| House | £295,164 | +0.8% | 36 days | 1 day slower | 99.9% | Up 0.1 % points |
| Flat | £216,380 | +4.0% | 56 days | 26 days slower | 95.4% | Down 3.4 % points |
Here’s how East Fife’s market performed during June - August 2026:
- Average selling price: £273,926 (up 1.9% year-on-year)
- Sales volumes: Down 11.0% on last year
- Buyer incentives: Homes achieved 98.6% of Home Report valuation on average
- Sales with a closing date: 16.2%, up from 11.0% last year
- Properties listed as 'Offers Over': 97.0%, up from 82.5% last year
East Fife market spans value to premium demand
Kirkcaldy remains East Fife’s most affordable market by some distance, averaging £148,601. However, sales fell 31.3% and prices dropped 19.9% year-on-year, suggesting the budget-conscious end of the market is cooling faster than elsewhere in the region. At the more premium end, St Andrews recorded the most sales in the region, up 21.7% year-on-year, while average prices rose 12.2% to £394,143. Four-bedroom houses averaged £639,500, up 7.2%.
Cupar's quiet momentum
Cupar posted the second most sales in East Fife (up 14.3% year-on-year) with an average selling price of £235,836 (up 8.6%), while the proportion of sales going to a closing date jumped to 25%, from around 14% last year. New listings in this charming market town rose 63.6% annually, giving Cupar some of the best stock levels in the region.
A cooling but resilient market
Sales across East Fife fell 11%, yet average selling prices rose 1.9% to £273,926... fewer transactions, but sellers achieving strong prices for them. Competition hasn't disappeared either: the share of properties marketed offers over jumped to 97% (from 82.5% last year), and sales involving a closing date rose to 16.2% (from 11%)... even as the proportion of properties achieving Home Report valuation slipped slightly to 98.6%.
Inside the West Lothian property market
| Property Type |
Average House Price |
Annual Change |
Median Time To Sell |
Annual Change |
% of Home Report Valuation Achieved |
Annual Change |
| House | £341,639 | +11.1% | 27 days | 7 days faster | 101.6% | Down 0.5 % points |
| Flat | £150,667 | +9.1% | 39 days | 2 days slower | 98.3% | Up 2.4 % points |
Here’s how West Lothian’s market performed during June - August 2026:
- Average selling price: £320,931 (up 9.5% year-on-year)
- New listings: Up 40.8% compared to June - August 2025
- Time to under offer: 27 days (seven days faster than last year)
- Sales with a closing date: 12.0%, down from 17.0% last year
- Properties listed as 'Offers Over': 69.0%, up from 66.2% last year
West Lothian sees strong price growth
Livingston remained the region’s busiest market despite volumes dipping 16.7% year-on-year. Average prices rose 22.4% to £292,874, while new listings surged 86.7%. Elsewhere, Winchburgh and Bo’ness delivered standout price growth. Winchburgh’s average selling price climbed 28.8% to £429,747, while Bo’ness recorded the sharpest increase in the region, with prices rising 61.1% to £267,421.
A smaller but pricier market
Sales fell 11.7%, yet the average selling price rose 9.5% to £320,931 and the median jumped 8.2% to £291,500 - pointing to fewer but larger transactions. Closing dates eased to 12.1% of sales (from 17.0%), and the share of homes achieving at least Home Report valuation slipped to 69.3% (from 78.3%) - suggesting a slightly less competitive market than last year, even as prices climbed.
Inside the Scottish Borders property market
| Property Type |
Average House Price |
Annual Change |
Median Time To Sell |
Annual Change |
% of Home Report Valuation Achieved |
Annual Change |
| House | £276,016 | +3.5% | 25 days | 5 days slower | 100.2% | Down 2.3 % points |
| Flat | £135,800 | +25.6% | 17 days | 6 days slower | 99.9% | Up 3.0 % points |
Here’s how the Borders’ market performed during June - August 2026:
- Average selling price: £237,775 (up 11.9% year-on-year)
- New listings: Up 5.0% compared to the same period last year
- Sales volumes: Up 13.5% year-on-year
- Median time to under offer: 23 days (same as last year)
- Sales with a closing date: 9.5%, down from 11.7% last year
- Properties listed as 'Offers Over': 55.1%, down from 57.2% last year
The Scottish Borders market gathers momentum
The Scottish Borders recorded a strong quarter overall, with sales up 13.5% year-on-year and average prices rising 11.9% to £237,775. The number of new homes coming onto the market rose by 5.0% between June - August, while the speed of market kept pace with the same period last year. Competition eased slightly, however, with fewer sales reaching a closing date and percentage of Home Report valuation achieved dipping slightly by 0.3 percentage points.
Kelso and Peebles lead the premium market
Kelso and Peebles delivered some of the region’s strongest price growth, with average selling prices rising 65.5% and 33.0% respectively. Three-bedroom houses in Kelso were particularly popular, while four-bedroom homes in Peebles performed strongly at the more premium end. Properties in Peebles went under offer sixteen days faster than last year, but were still slower to sell than homes in Hawick (11 days) and Galashiels (13 days).
Galashiels and Hawick drive activity
Galashiels remained the Borders’ busiest major market, with sales volumes up 18.2% and average prices rising 6.8% to £164,169. Hawick saw the strongest growth in sales, up 69.2%, however, its average price fell 15.0% to £131,136. Sellers in Galashiels were buoyed by an average % of Home Report valuation of 102.7%.
FIND OUT HOW MUCH YOUR HOME IS WORTH
Want to find out more about our House Price Reports? Read our House Price Report FAQs, or check out our House Price Reports Explained series.
Find out average property selling prices for different areas and property types in our house price table.
See data for previous months and years in our historical house price spreadsheet.
ESPC is the home of property and we're here to help you with every step of your home-buying and selling journey. If you're thinking of buying or selling a property soon, why not drop into our Property Lounge to chat with one of our experts. Sellers can also get a free property valuation with ESPC agents.