House Price Report September 2019
Property market data – key points
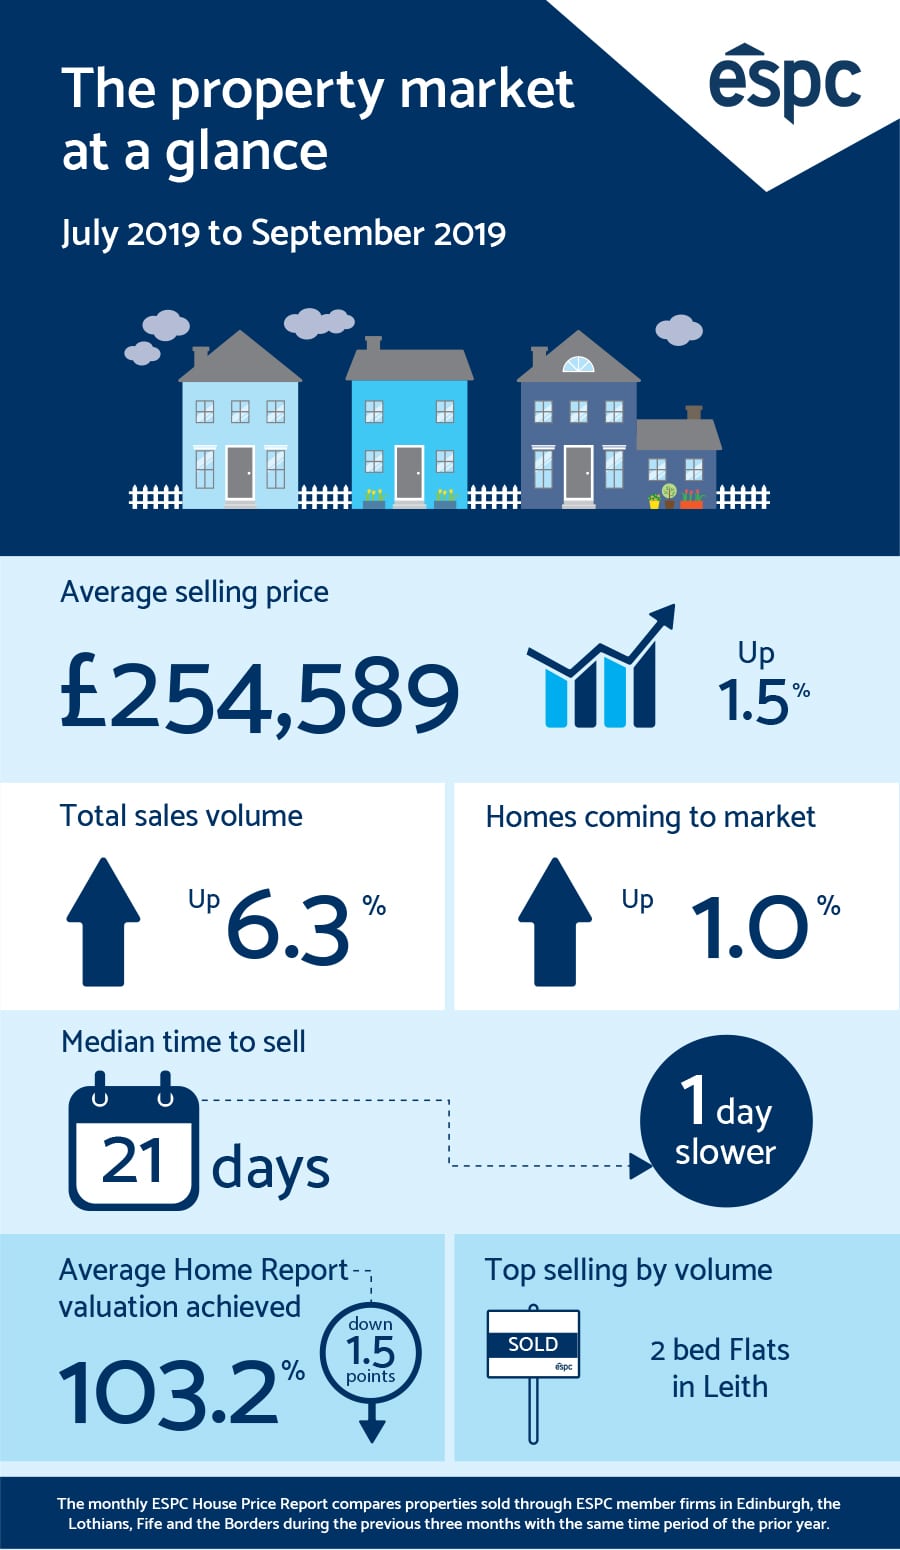
- From July to September 2019, average selling prices across Edinburgh, the Lothians Fife and the Borders increased by 1.5%
- During this period, sales volume rose by 6.3% compared to the previous year
- The number of homes coming to market has risen by 1.0% annually over the last 3 months
- The average percentage of Home Report valuation achieved was 103.2%, compared to 104.7% last year
- On average, properties took 21 days to go under offer in the last three months, one day longer than last year
Quicklinks
Average property selling prices in Edinburgh, the Lothians, Fife and the Borders
Sales volume and number of properties coming to market
Property selling times in Edinburgh, the Lothians, Fife and the Borders
Percentage of Home Report valuation achieved
Top selling properties by volume
Steadier market may be favourable for first time buyers
House Price Report September 2019 infographic
Average property selling prices in Edinburgh, the Lothians, Fife and the Borders
Over the last three months, the average selling price for residential properties in Edinburgh, the Lothians Fife and the Borders was £254,589, a 1.5% increase on the same period last year. Within Edinburgh, the average selling price increased by 2.4% to £276,995.
Inside the capital boundary, three bedroom homes in South Queensferry have seen a large rise in average selling prices since last year, increasing by 27.2%. This significant uplift is largely due to a reduced number of terraced home sales, and a greater proportion of detached and semi-detached houses selling in recent months.
However, 2 bedroom flats in the Marchmont and Bruntsfield area saw a 4.0% decrease in average selling prices over the same period. This was due to a reduction in volume of higher value properties selling, with a concurrent drop in the average Home Report valuation achieved.
Outside of the city, homes in Midlothian saw an increase in average selling prices, up to £220,554, 9.3% greater than last year. The average selling price in East Fife increased by 4.8%, while West Fife & Kinross dropped by 6.7%. Average selling prices of properties in the Borders reduced by 5.8% over the same period.
Sales volume and number of properties coming to market
Between July and September 2019, the volume of sales in Edinburgh, the Lothians, Fife and the Borders increased by 6.3%, with volume in the capital rising by 4.8%.
The number of properties coming to market in the region increased at a slower rate, growing by 1.0% since last year, with growth in Edinburgh city at 0.1% over the same period.
Property selling times in Edinburgh, the Lothians, Fife and the Borders
Across Edinburgh, the Lothians, Fife and the Borders, the median time to sale was 21 days, which is one day slower than the same period last year. In the city, the median time to sell was 19 days, also one day slower than last year.
Consistently popular with buyers, 1 bedroom flats in the Leith Walk, Easter Road, Pilrig & Bonnington area recorded a median selling time of 13 days, one day quicker than the previous year. Properties in this area also achieved 107.1% of Home Report valuation on average, indicating high demand.
Percentage of Home Report valuation achieved
Over the last three months in Edinburgh, the Lothians, Fife and the Borders, the average Home Report valuation achieved decreased by 1.5 percentage points to 103.2%. In the city, the figure reduced by 1.7 points.
In Edinburgh, the reduction in Home Report valuation achieved has been most significantly witnessed across sales of flats, which saw a 2.1 percentage point drop since last year. Meanwhile, larger homes experienced growth in average Home Report valuation achieved, with 3 bedroom houses in Cramond, Barnton and Cammo increasing by 5.8 points since the previous year.
Despite the overall downward trend of city flats achieving lower percentages of Home Report valuations, 1 bedroom flats in Dalry, Gorgie, Slateford and Chesser still achieved the greatest percentage, at 107.8%, demonstrating that demand, while not as strong as previously, is still high.
Top selling properties by volume
Two bedroom flats in Leith, one of the most consistently popular property types, again achieved the highest volume of sales, however the volume was 10.6% lower than last year.
Two bedroom flats in Corstorphine recorded a 105.3% increase in sales volume since last year, becoming the second most popular property type in Edinburgh, the Lothians, Fife and the Borders.
Steadier market may be favourable for first time buyers
Jamie Fraser-Davidson, Business Analyst at ESPC, said: “While average selling prices continue to rise year-on-year, the 1.5% rise seen over the last three months is the slowest annual growth seen in recent years.
“Over the last twelve months, market conditions have experienced a different trend compared to the previous five years. It has been common to see the percentage above Home Report valuation achieved to cool slightly from September over the winter months, to a low in February/March before rising again over the summer months.
“The trough to peak change in average percentage of Home Report valuation achieved annually between 2014 and 2018 has ranged from 1.8 points in 2018 to 4.5 points in 2014. In 2019 the range was 1.1 points, from 102.5% in March 2019 to 103.6% in August 2019. This year has been the first in five years where the summer market hasn’t seen a sharp rise in average Home Report valuation achieved.
“This dampening, combined with the slowing of growth in sale prices and the rise in sales volume suggests that while demand for homes remains high, the competition among buyers may be waning.
“This apparent cooling of competition between buyers may be favourable for first time buyers, as they have traditionally required large cash amounts to offer over Home Report value. First time buyers may be better able to secure properties in a less competitive market.”
House Price Report August 2019 infographic

Find out more
Find out house prices in different areas in the September 2019 house price table.
Want to know about previous months and years? Read our historical house price data for Edinburgh, the Lothians and Fife.
Got a question? Have a look at our House Price Report FAQs.