ESPC House Price Report - July 2026
Every month, we publish the latest information about the local property market such as the average house price in Edinburgh, the Lothians, Fife and the Scottish Borders. You'll also find information on selling times, sales volumes, the number of properties coming to market and many more statistics in the house price report. Read on to find out the latest house price information.
Regional Quicklinks
Edinburgh | East Lothian | Midlothian | West Fife & Kinross | East Fife | West Lothian | Scottish Borders
Key Takeaways
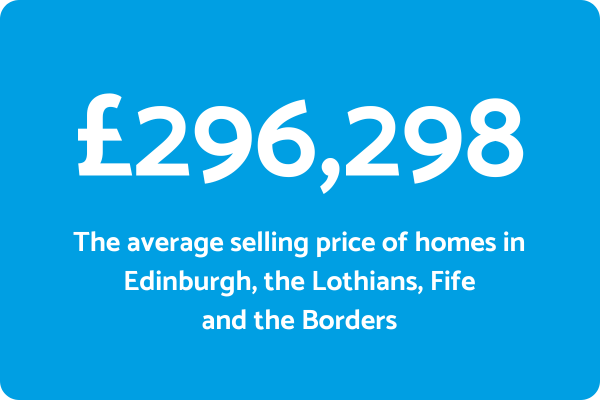
- The average selling price of property in Edinburgh, the Lothians, Fife and the Borders was £296,298 during May–July 2026, up 2.7% year-on-year.
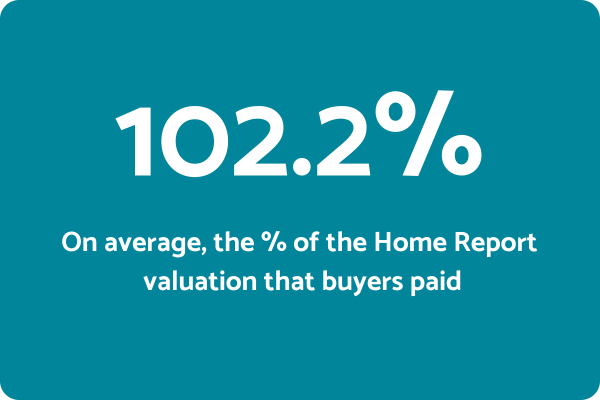
- Properties achieved 102.2% of their Home Report valuation on average, down 0.3 percentage points from last year.
- New property listings were down 6.1% while sales volumes decreased by 7.0%.
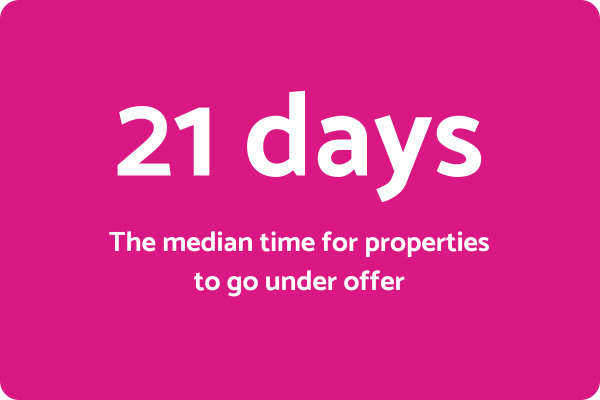
- The median selling time for property was 21 days, the same as the period May–July 2025.
- 8% of homes went to a closing date, down from 22.1% last year.
Inside the Edinburgh property market
| Property Type |
Average House Price |
Annual Change |
Median Time To Sell |
Annual Change |
% of Home Report Valuation Achieved |
Annual Change |
| House | £414,458 | -0.1% | 21 days | 2 days faster | 102.9% | Up 0.3 % points |
| Flat | £270,593 | +2.4% | 20 days | No change | 102.5% | Down 0.2 % points |
Here's how Edinburgh's market performed between May - July 2026:
- Average selling price: £310,332 (up 0.3% year-on-year)
- Time to under offer: 20 days (one day quicker than last year)
- New listings: Down 8.1% compared to the same period last year
- Sales volumes: Down 5.3% year-on-year
- Sales with a closing date: 22.3%, down from 24.5% last year
- Properties listed as 'Offers Over': 88.0%, up from 76.6% last year
Leith holds firm as Edinburgh's busiest area
Leith continued to lead the way in Edinburgh, with sales volumes matching the same period last year. Properties in the area continued to sell quickly too, with a median time to sell of 15 days, unchanged year-on-year. One- and two-bedroom flats remain the mainstay of Leith's market. One-bedroom flats saw sales volumes rise 15.8% year-on-year, with the average selling price up 3.2% to £190,527.
Corstorphine performs well despite fewer sales
Corstorphine also had a strong period, despite sales volumes falling 21.2% year-on-year. The average selling price rose 2.0% to £341,407, while the median time to sell dropped to 21 days, nine days quicker than last year.
Gorgie offers strong value
Gorgie stood out as one of Edinburgh's best-value areas, with sales volumes up 21.4% year-on-year and the average selling price rising a modest 0.8% to £176,274.
A resilient capital market
Edinburgh's market held broadly steady during May–July 2026. Sales volumes and new listings both eased compared to last year, but prices remained resilient across houses and flats alike, and well-established areas such as Leith and Corstorphine continued to attract strong, consistent demand. With more properties listed as 'Offers Over' than last year, sellers appear to be pricing with confidence even as the pace of the market softens slightly.
Inside the East Lothian property market
| Property Type |
Average House Price |
Annual Change |
Median Time To Sell |
Annual Change |
% of Home Report Valuation Achieved |
Annual Change |
| House | £359,437 | +6.2% | 20 days | 1 day faster | 102.4% | Down 0.3 % points |
| Flat | £204,361 | +1.0% | 22 days | 2 days slower | 100.8% | Down 0.6 % points |
Here’s how East Lothian’s market shaped up during May - July 2026:
- Average selling price: £319,144 (up 8.3% year-on-year)
- Time to under offer: 21 days (unchanged from last year)
- New listings: Up 12.4% compared to the same period last year
- Sales volumes: Down 3.2% year-on-year
- Sales with a closing date: 18.5%, down slightly from 18.9% last year
- Properties listed as 'Offers Over': 87.0%, up from 78.7% last year
Dunbar, Haddington and North Berwick drive strong growth
East Lothian's towns continued to perform strongly, with notable sales volume increases in Dunbar (up 5.9%), Haddington (up 22.0%) and North Berwick (up 3.3%), each alongside rising average selling prices. Dunbar's average selling price rose 4.7% to £331,498, with properties selling in 24 days (nine days quicker than last year). Haddington's average selling price increased 12.3% to £292,328, selling in 18 days (six days quicker). North Berwick recorded the strongest price growth of the three, up 14.1% to £506,744, with a median selling time of just 13 days - 18 days quicker than last year.
Tranent offers value, East Linton sells fastest
Tranent remains East Lothian's most affordable town, with an average selling price of £231,735, while East Linton was the region's fastest-selling area, with a median time to sell of just 12 days.
North Berwick stands out as East Lothian's premium hotspot
North Berwick continues to command the region's premium prices, with the average selling price up 14.1% year-on-year to £506,744, comfortably the highest in East Lothian. Demand remained exceptionally strong, with properties selling in a median of just 13 days, 18 days quicker than last year, underlining North Berwick's enduring appeal to buyers seeking a coastal, higher-value lifestyle.
A market of two speeds
East Lothian's spring market told two stories side by side: steady, broad-based price growth across its commuter towns, and a smaller number of premium areas like North Berwick pulling further ahead. With sales volumes down slightly and listings up, buyers appear to have had a little more choice this period, even as competition for the best properties in sought-after locations remained intense.
Inside the Midlothian property market
| Property Type |
Average House Price |
Annual Change |
Median Time To Sell |
Annual Change |
% of Home Report Valuation Achieved |
Annual Change |
| House | £317,556 | +6.7% | 25 days | 4 days slower | 101.3% | Down 0.9 % points |
| Flat | £162,919 | -7.9% | 24 days | 9 days slower | 100.8% | Down 2.0 % points |
Here’s how Midlothian’s market performed between May - July 2026:
- Average selling price: £277,391 (up 2.5% year-on-year)
- Time to under offer: 24 days (five days slower than last year)
- New listings: Down 9.9% compared to the same period last year
- Sales volumes: Down 22.7% year-on-year
- Sales with a closing date: 17.3%, down from 27.4% last year
- Properties listed as 'Offers Over': 84.8%, up from 75.2% last year
Bonnyrigg and Penicuik remain the busiest towns
Bonnyrigg and Penicuik continue to be Midlothian's busiest towns by sales volume, though both saw volumes fall year-on-year, Bonnyrigg down 14.0% and Penicuik down 21.8%. Loanhead offers the most affordable route into the area, with an average selling price of £251,408.
A quieter but steady period
Midlothian's market cooled somewhat during May–July 2026, with sales volumes and new listings both down on last year and selling times a little longer, particularly for flats. Prices held up overall, though, with houses continuing to command reasonable premiums over Home Report valuation. It's a market that looks less frenzied than last year, but still fundamentally healthy.
Inside the West Fife & Kinross property market
| Property Type |
Average House Price |
Annual Change |
Median Time To Sell |
Annual Change |
% of Home Report Valuation Achieved |
Annual Change |
| House | £247,122 | -6.9% | 14 days | No change | 102.8% | Down 1.2 % points |
| Flat | £145,009 | +6.6% | 19 days | 6 days slower | 104.2% | No change |
Here’s how the market looked in West Fife & Kinross during May - July 2026:
- Average selling price: £224,776 (down 3.1% year-on-year)
- Time to under offer: 15 days (one day slower than last year)
- New listings: Down 12.3% compared to the same period last year
- Sales volumes: Down 15.4% year-on-year
- Sales with a closing date: 16.7%, down from 20.8% last year
- Properties listed as 'Offers Over': 91.9%, up from 87.5% last year
Dunfermline continues to dominate
Dunfermline continues to account for the largest share of sales activity in West Fife & Kinross. Sales volumes were down 13.0% year-on-year and the average selling price fell 6.8% to £226,956, but properties continued to sell quickly, a median of 13 days, one day faster than last year. Three-bedroom houses in Dunfermline remained a particular strength, with sales volumes up 10.3% and the average selling price rising 3.2% to £250,489, selling in just 15 days. One-bedroom flats in Dunfermline remained the most affordable property type across the whole market, with an average selling price of £106,114.
Affordability continues to drive the market
West Fife & Kinross remains one of the region's most accessible markets, with average selling prices among the lowest across Edinburgh, the Lothians, Fife and the Borders. While sales volumes and listings were both down on last year, quick selling times and consistently high 'Offers Over' activity point to sustained demand from buyers prioritising value without compromising on location.
Inside the East Fife property market
| Property Type |
Average House Price |
Annual Change |
Median Time To Sell |
Annual Change |
% of Home Report Valuation Achieved |
Annual Change |
| House | £312,941 | +5.8% | 53 days | 2 days slower | 100.9% | Up 2.4 % points |
| Flat | £196,180 | -3.9% | 50 days | 28 days slower | 96.4% | Down 2.8 % points |
Here’s how East Fife’s market performed during May - July 2026:
- Average selling price: £281,787 (up 5.4% year-on-year)
- Time to under offer: 50 days (two days slower than last year)
- New listings: Down 24.3% compared to the same period last year
- Sales volumes: Down 6.7% year-on-year
- Sales with a closing date: 18.6%, up from 7.7% last year
- Properties listed as 'Offers Over': 94.5%, up from 84.8% last year
St Andrews and Cupar remain the region's busiest towns
St Andrews and Cupar continue to dominate East Fife by sales volume, with average selling prices rising in both - St Andrews to £404,131 and Cupar to £220,568.
A slower-paced but resilient coastal market
East Fife's market moved at a noticeably slower pace during May–July 2026, with selling times lengthening and sales volumes and listings both down on last year. Even so, prices continued to rise across the region, and the high proportion of homes listed as 'Offers Over' suggests sellers remain confident in the value of well-located coastal and market-town properties, even as buyers take longer to commit.
Inside the West Lothian property market
| Property Type |
Average House Price |
Annual Change |
Median Time To Sell |
Annual Change |
% of Home Report Valuation Achieved |
Annual Change |
| House | £330,138 | +8.4% | 31 days | 10 days faster | 100.8% | No change |
| Flat | £141,417 | -1.8% | 37 days | 4 days faster | 99.0% | Up 4.3 % points |
Here’s how West Lothian’s market performed during May - July 2026:
- Average selling price: £316,158 (up 9.5% year-on-year)
- Time to under offer: 31 days (ten days quicker than last year)
- New listings: Unchanged year-on-year
- Sales volumes: Down 1.2% year-on-year
- Sales with a closing date: 11.1%, up from 9.8% last year
- Properties listed as 'Offers Over': 67.7%, down from 68.7% last year
Livingston and East Calder lead the way
Livingston and East Calder both performed strongly this period. Livingston recorded a 5.3% rise in sales volumes and a 16.7% increase in average selling price, to £303,368. East Calder saw sales volumes up 7.7%, with the average selling price rising 3.1% to £378,941.
Prices climb as the market speeds up
West Lothian delivered one of the strongest price performances of any region this period, with the average selling price up 9.5% year-on-year and selling times ten days quicker than last year. With new listings holding steady and sales volumes broadly flat, the region looks well balanced, strong demand being met without the sharp supply squeezes seen elsewhere.
Inside the Scottish Borders property market
| Property Type |
Average House Price |
Annual Change |
Median Time To Sell |
Annual Change |
% of Home Report Valuation Achieved |
Annual Change |
| House | £276,643 | +9.2% | 24 days | 3 days slower | 101.3% | Down 1.3 % points |
| Flat | £143,702 | +31.4% | 14 days | 14 days faster | 100.5% | Up 1.7 % points |
Here’s how the Borders’ market performed during May - July 2026:
- Average selling price: £242,590 (up 17.2% year-on-year)
- Time to under offer: 19 days (six days quicker than last year)
- New listings: Up 2.4% compared to the same period last year
- Sales volumes: Up 1.3% year-on-year
- Sales with a closing date: 11.4%, down from 12.4% last year
- Properties listed as 'Offers Over': 57.3%, up from 56.7% last year
Galashiels, Kelso and Peebles remain the region's strongest performers
Galashiels, Kelso and Peebles remain the Borders' strongest-performing towns. Galashiels saw sales volumes rise 9.1% and the average selling price increase 30.4% to £180,757, with properties selling in just 11 days, seven days quicker than last year. Kelso's sales volumes fell 11.1%, but the average selling price rose 17.7% to £239,427, with the median time to sell down eight days to 20 days. Peebles recorded a 4.5% rise in sales volumes and a 32.3% increase in average selling price to £325,657, with the median time to sell down 12 days to 27 days. It's worth noting that the scale of the price increases in Galashiels and Peebles reflects a small number of high-value sales rather than a broad shift in the market – sales of properties over £500,000 in the Borders rose sharply this period, albeit from a low base, and this has skewed average prices upward.
Hawick remains the most affordable town
Hawick remains the most affordable town in the Scottish Borders, with an average selling price of £149,794.
Confidence returns to the Borders
The Scottish Borders recorded the strongest price growth of any region this period, up 17.2% year-on-year, alongside faster selling times and a modest rise in sales volumes. Strong performances in Galashiels and Peebles were a key driver of this, though the scale of their price growth was influenced by a small number of high-value sales rather than a broad shift in buyer behaviour. Even so, faster selling times and steady demand across the region's towns point to underlying confidence holding firm in the Borders market.
Buyer and seller activity
May 2025 was an especially strong month for the market, which is reflected in some of the year-on-year comparisons above; June and July have tracked closely between 2025 and 2026. During May 2026, the market was still feeling the effects of external factors, including the conflict in the Middle East, which contributed to higher mortgage rates and a more cautious approach among some buyers.
Despite this, buyer and seller engagement with ESPC remained strong. Average daily views of properties on espc.com rose 10% year-on-year across all areas, new My ESPC account sign-ups were up 12%, and seller enquiries rose over double year-on-year.
FIND OUT HOW MUCH YOUR HOME IS WORTH
Want to find out more about our House Price Reports? Read our House Price Report FAQs, or check out our House Price Reports Explained series.
Find out average property selling prices for different areas and property types in our house price table.
See data for previous months and years in our historical house price spreadsheet.
ESPC is the home of property and we're here to help you with every step of your home-buying and selling journey. If you're thinking of buying or selling a property soon, why not drop into our Property Lounge to chat with one of our experts. Sellers can also get a free property valuation with ESPC agents.