House Price Report December 2019
Property market data – key points
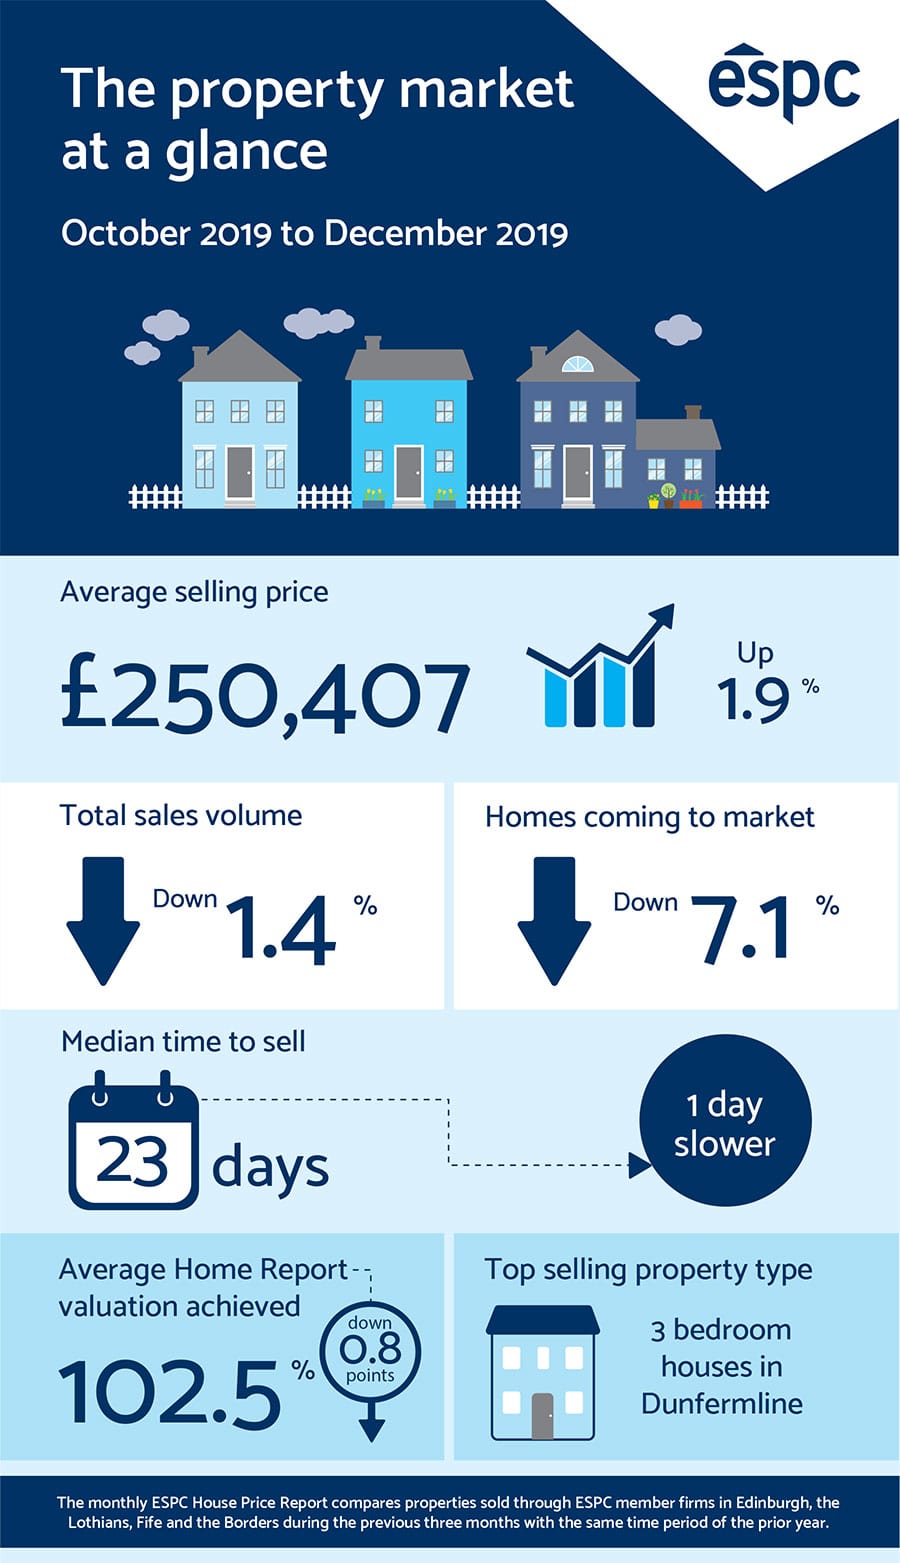
- From October to December 2019, the average selling price of properties in Edinburgh, the Lothians, Fife and the Borders increased by 1.9% year-on-year, rising from £245,815 to £250,407
- Over the past three months, the sales volume in these areas dipped by 1.4% compared to last year
- In the last quarter of 2019, the volume of homes coming to market fell by 7.1% compared to the same period in 2018
- The median time for a property to go under offer in Edinburgh, the Lothians, Fife and the Borders during this timeframe was 23 days, which was one day slower than last year
- Between October and December 2019, the average percentage of Home Report valuation attained was 102.5% compared to 103.3% last year.
Quicklinks
Average property selling price in Edinburgh, the Lothians, Fife and the Borders
Sales volume and number of properties coming to market
Property selling times in Edinburgh, the Lothians, Fife and the Borders
Percentage of Home Report valuation achieved
Top selling properties types by sales volume
Decline in properties coming to market as 2019 ends
House Price Report infographic
Average property selling price in Edinburgh, the Lothians, Fife and the Borders
After the November 2019 House Price Report revealed the average selling price in Edinburgh, the Lothians, Fife and the Borders to remain steady, figures from October to December show it to have increased slightly compared to last year, rising by 1.9% to £250,407.
In Edinburgh, the average property selling price rose by 1.8% year-on-year to £269,904 – properties in the north west of the city saw the great growth in selling price, which increased by 10.4% to £248,218.
Within Edinburgh, three bedroom houses in Cramond, Barnton and Cammo saw a 50.7% increase in average selling price, while three bedroom house in South Queensferry and Dalmeny experienced a 41.5% rise.
While these increases may seem very significant on the surface, in both cases, this was due to the properties being sold, some of which were at a much higher value, which subsequently pushed up the average price.
However, three bedroom houses in Blackhall, Davidsons Mains and Silverknowes saw a 23.3% decline in average selling price. This is due to a greater proportion of lower value homes being sold in these areas this year.
Properties in East Lothian also saw a significant increase in average selling price, rising by 11.7% to £257,972. In West Lothian, properties saw a 7.4% increase while there was a 4.2% increase in the Borders.
In West Fife & Kinross, the last three months of 2019 saw the average property selling price decrease by 6% to £169,537. In Dunfermline, there was a 9% decrease in average selling price.
Find out average selling prices for different areas and properties in our house price table.
Sales volume and number of properties coming to market
Over the last three months, the volume of properties coming to market in Edinburgh, the Lothians, Fife and the Borders fell by 7.1%, which coincided with a 1.4% drop in sales volume compared to the previous year.
Within Edinburgh, there was a 14.1% decline in the number of homes coming to market alongside a 3.2% drop in sales volume.
Property selling times in Edinburgh, the Lothians, Fife and the Borders
In the last quarter of 2019, the median time of properties to go under offer in Edinburgh, the Lothians, Fife and the Borders was 23 days, which was one day slower than last year. In Edinburgh, the median selling time was 20 days, which was the same as last year.
Two bedroom flats in Portobello and Joppa boasted the shortest selling time at 15 days, which was four days slower than last year.
Percentage of Home Report valuation achieved
Over the past three months, the average percentage of Home Report valuation achieved in Edinburgh, the Lothians, Fife and the Borders was 102.5% compared to 103.3% last year. Within Edinburgh, it was 104% compared to 104.9% last year.
Two bedroom flats in Portobello and Joppa achieved the highest percentage of Home Report valuation on average at 110.6%, rising by two percentage points compared to last year.
Top selling properties types by sales volume
The property type with the greatest sales volume over this period was three bedrooms houses in Dunfermline, followed by two bedroom flats in Dunfermline and one bedroom flats in Gorgie.
Decline in properties coming to market as 2019 ends
Jamie Fraser-Davidson, Business Analyst at ESPC, said: “The end of 2019 saw a slight increase in average selling price in Edinburgh, the Lothians, Fife and the Borders, along with a slight decrease in sales volume. However, the most notable figure was the drop in the number of homes coming to market, particularly in Edinburgh.
“This could be a result of seller confidence being dampened by the General Election and upcoming Brexit deadline, or that sellers are being deterred through lack of choice of new properties. However, it is also worth noting that the final quarter of 2018 saw a significant spike in the number of new homes coming to market, making a year-on-year decrease in 2019 more likely.
“The two property types with the top sales volume are in Dunfermline – the Fife town has experienced a 31.1% year-on-year increase in sales volume, suggesting people are looking for homes out of the city, yet with easy access to local amenities and transport links.”
House Price Report infographic
Download our House Price Report December 2019 infographic.
Find out more
Interested in learning more about the local property market and what happened in 2019? Come along to our free Property Market Insights event on the 14th January.
Find out average property selling prices for different areas and property types in our house price table and use our useful explore areas tool to find out useful statistics about different areas. Plus, find out how much your house is worth with our free property valuation service.
Find out what happened in previous months and years in our historical house price data.
Want to find out more about our House Price Reports? Read our House Price Report FAQs.
You may also be interested in…
How has the property market changed over the past decade?
House Price Report November 2019
Mortgage and property market predictions for 2020