House Price Report November 2018

Download the House Price Report November 2018 infographic.
Key points
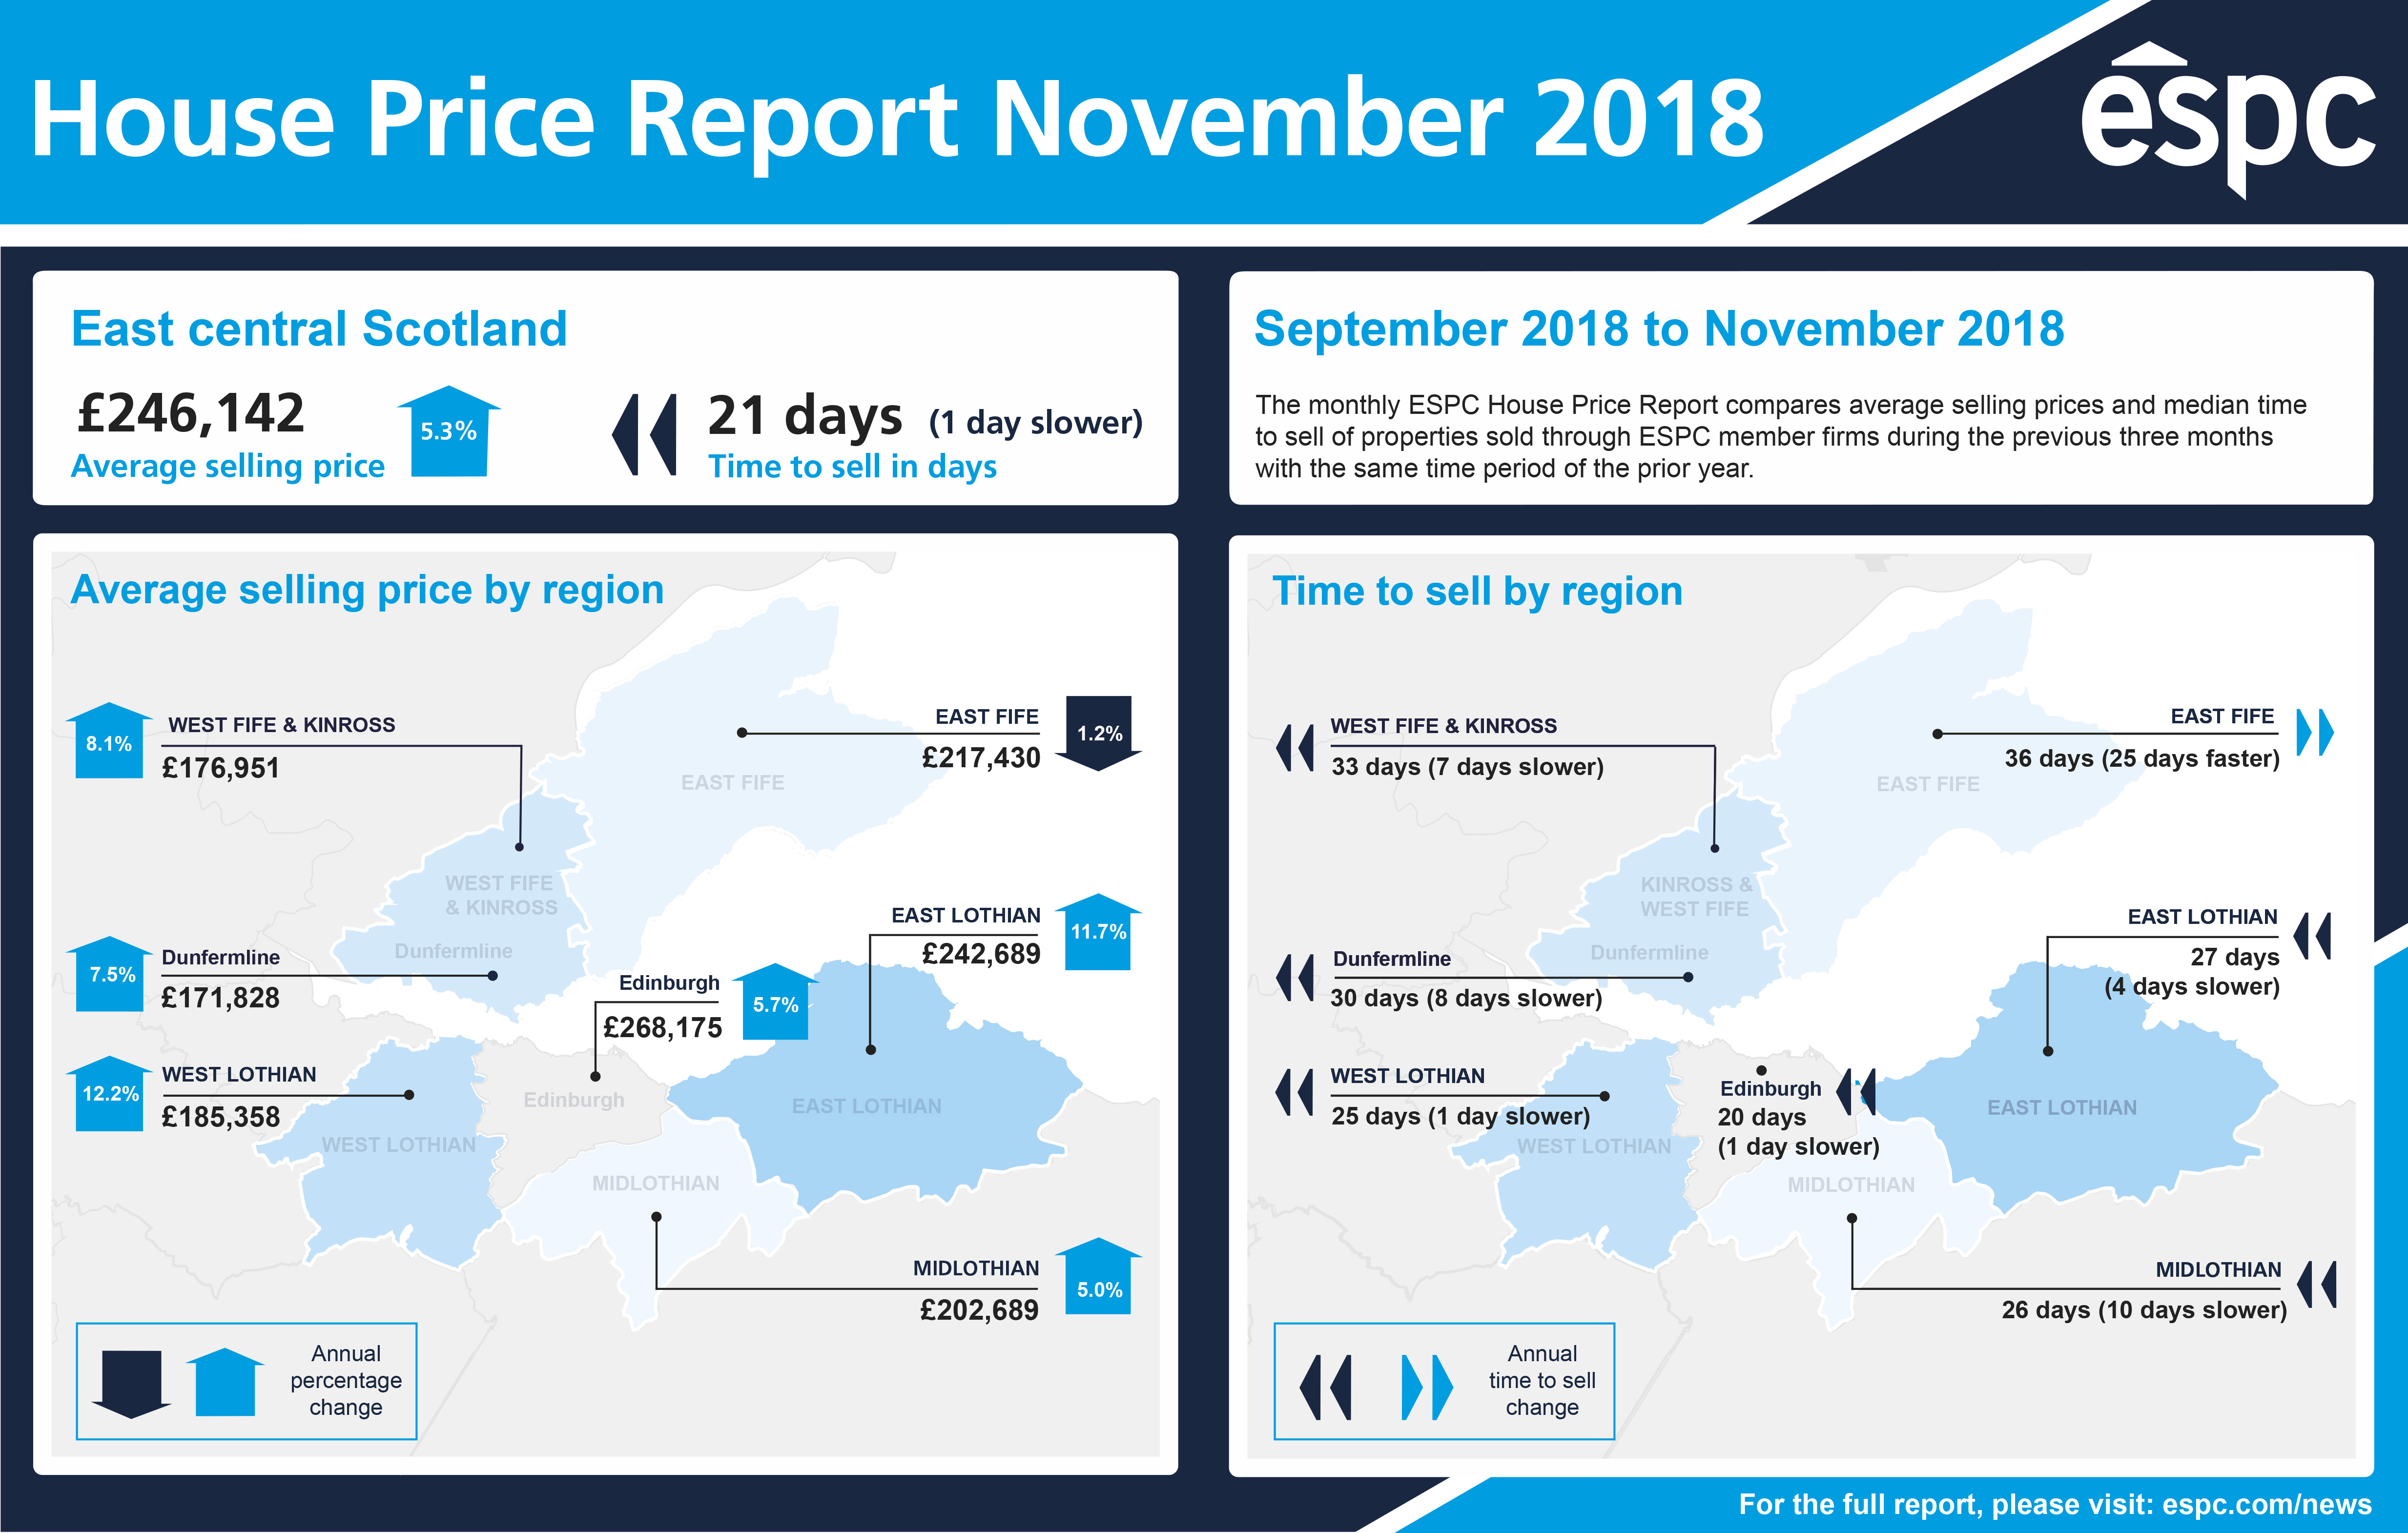
- Between September and November 2018, the average selling price in east central Scotland rose to £246,142 compared to £233,681 for the same period last year, which was a 5.3% increase
- The number of homes sold during this period increased by 1.4% annually
- The number of homes brought to market increased by 14.1% annually
- From September to November 2019, the median selling time for properties in east central Scotland was 21 days, which was one day slower than the same period last year
- During this period the average percentage of Home Report valuation achieved was 103.9% compared to 103.7%
- 84.8% of properties were marketed as ‘offers over’ compared to 84.3% last year.
Seller confidence and buyer demand stay strong in east central Scotland property market
Between September and November 2018, there was a significant year on year increase in the number of homes coming to market in east central Scotland, with the volume of insertions up 14.1% compared to last year. Within Edinburgh, the number of homes coming to market increased by 5.5% during this period. This continued trend of an increase in the number of homes coming to market is a positive sign for buyers, and indicates the continued confidence of sellers, despite the uncertainty of Brexit.
The number of properties sold during this period increased by 1.4% annually. This increase is the positive result of an increasing number of homes being brought to market in recent months.
Average property selling price in east central Scotland
The average selling price in east central Scotland rose to £246,142 during this period, a 5.3% increase on last year. Within the capital, the average selling price was £268,175 which was a 5.7% increase compared to last year.
Selling trends for flats and houses around Edinburgh and the Lothians
In Edinburgh, two bedroom flats in the coastal districts of Portobello and Joppa saw the biggest year on year increase in average selling prices, rising by 22.5% to £254,442. Two bedroom flats in Trinity, Newhaven and Inverleith also rose by 18.7% to £258,898.
One bedroom flats in Polwarth, Shandon and Tollcross achieved the highest average percentage over Home Report valuation at 111.9%, followed by one bedroom flats in Dalry, Gorgie, Slateford and Chesser which achieved 109.8% of their valuation on average.
The average selling price of three bedroom houses in Liberton and Gilmerton dropped by 11.3% to £227,523.
From September to November 2018, the average selling price of properties in West Lothian rose by 12.2% to £185,358. In East Lothian, the average selling price rose by 11.7% to £242,689.
How quickly are flats selling in Edinburgh?
One bedroom flats in Leith Walk, Easter Road, Pilrig and Bonnington and two bedroom flats in New Town and West End were the quickest to sell, with a median selling time of 13 days.
The top selling property type from September to November 2018 was two bedroom flats in Leith, followed by three bedroom houses in Dunfermline and two bedroom flats in Newington.
Thinking of selling your home?
Make sure to get the best price for your home with an ESPC solicitor estate agent.
Brexit and the east central Scotland property market
Jamie Fraser-Davidson, Business Analyst at ESPC, said: “Despite approaching Brexit, it appears seller confidence in the east central Scotland property market is staying strong with the number of homes coming to market continuing to increase compared to last year. Average selling prices are also rising steadily, and properties are regularly achieving their Home Report valuation, as well as short selling times, indicating that the significant demand from buyers continues.
“ We expect the east central Scotland property market to be relatively resilient throughout the changes that leaving the EU will bring, in comparison to other areas of the UK, some of which are starting to show signs of stress.”
Further information on the east central Scotland property market
View the house price table.
Got a question? Have a look at our House Price Report FAQs.
Want to know about previous months and years? Read our historical house price data.
Data from the Scottish Borders is not included in the east central Scotland summary figures. However, the average selling price of properties in the Scottish Borders can be found in the house price table.