House Price Report December 2018
Download the House Price Report December 2018 infographic.
Key Points
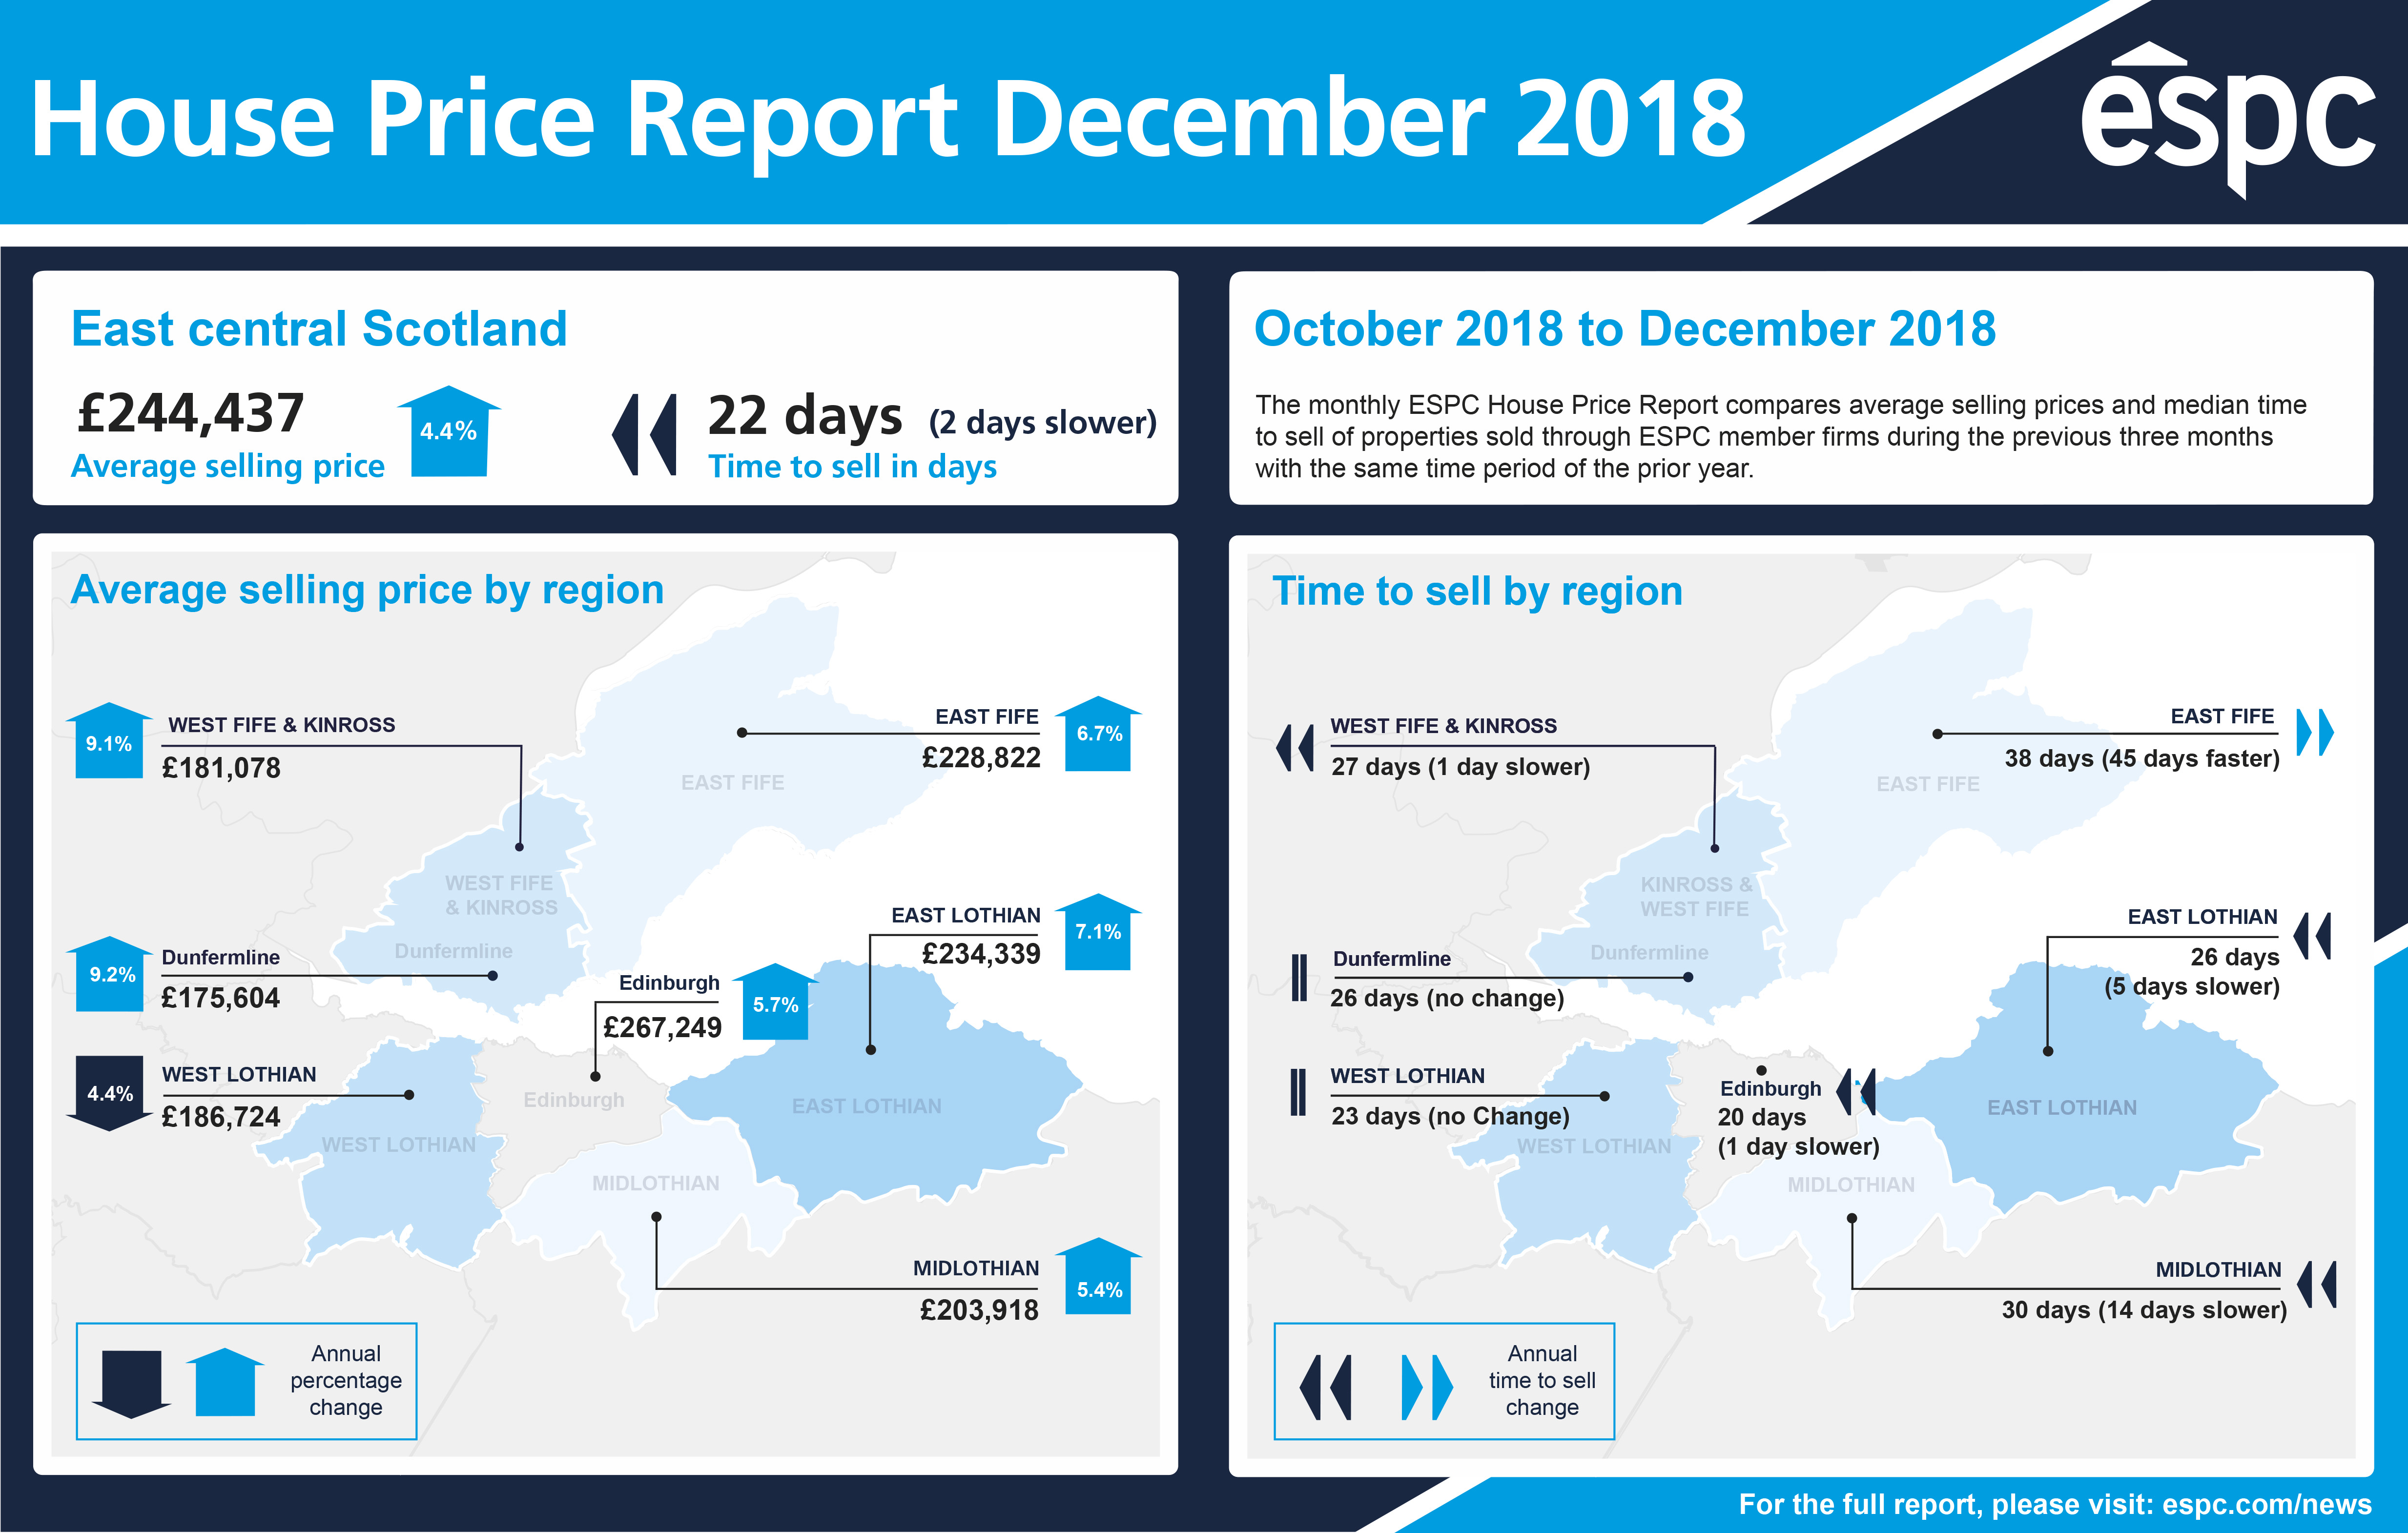
- Between October and December 2018, the average selling price of homes in east central Scotland rose to £244,437 compared to £234,203 for the same period in 2017, which was a 4.4% increase
- The number of homes sold in east central Scotland during this three month period increased by 9.2% annually
- The number of homes brought to market between October and December 2018 increased by 23.9% year-on-year
- Between October and December 2018, homes achieved 103.3% of their Home Report valuation on average, compared to 103.7% for the same period last year
- During this three month period, the median time to sell was 22 days compared to 20 days last year
- From October to December 2018, 24.3% of sales went to a closing date compared to 28.8% last year.
End of 2018 sees significant upswing in number of properties coming to market
The final three months of 2018 saw further positive news for buyers, with a 23.9% increase in the number of homes coming to market compared to the same period last year in east central Scotland. Within Edinburgh, there was a 14.7% increase in the number of homes coming to market. This increased supply of properties coming to market in the last months of 2018 is a good sign for those planning to purchase a home in the early months of 2019. The significant increase in the number of homes coming to market in the later months of 2018, coupled with strong demand, has also resulted in a 9.2% increase in the number of properties sold during this period compared to last year.
Property selling prices continue to increase in east central Scotland
Steady increases in average selling prices are also still evident. Between October and December 2018, the average selling price rose by 4.4% to £244,437 compared to last year. Within Edinburgh, the average selling price rose by 5.7% to £267,249.
From October to December 2018, three bedroom houses in Blackhall, Davidsons Mains, Silverknowes, Cramond, Barnton and Cammo saw the biggest year-on-year increase in average selling price, rising by 23.5% to £401,131. The average selling price of two bedroom flats in New Town and West End also rose by 20.4% to £428,255.
Outwith the capital, areas also saw a reasonable increase in average selling prices compared to last year. In Dunfermline, the average selling price of properties rose by 9.2% to £175,604 while in the Scottish Borders, prices rose by 8.8% to £223,189.
Fastest seller, highest Home Report valuation achieved and top sales volume
From October to December 2018, two bedroom flats in Portobello and Joppa offered the shortest selling times with a median selling time of 13 days. However, one bedroom flats in Polwarth, Shandon and Tollcross achieved the highest Home Report valuation on average at 111.7%. Two bedroom flats in Leith achieved the highest sales volume during this period.
Looking forward to 2019
Jamie Fraser-Davidson, Business Analyst at ESPC, said: “At the start of 2018, the east central Scotland property market was limited by the shortage of properties coming to market so it is encouraging to see a significant upswing in the number of new listings in the final few months of the year – this is a good sign for buyers. At the same time, average selling prices are continuing to rise at a steady pace which is positive news for sellers.
“Although it’s still unclear exactly what 2019 will bring in terms of changes to the UK housing market, particularly considering the uncertainty of Brexit, the east central Scotland property market ended 2018 in a strong position and appears set to face the challenges of the upcoming months.”
Find out more
View the house price table.
Got a question? Have a look at our House Price Report FAQs.
Want to know about previous months and years? Read our historical house price data.
Data from the Scottish Borders is not included in the east central Scotland summary figures. However, the average selling price of properties in the Scottish Borders can be found in the house price table.